At A Glance
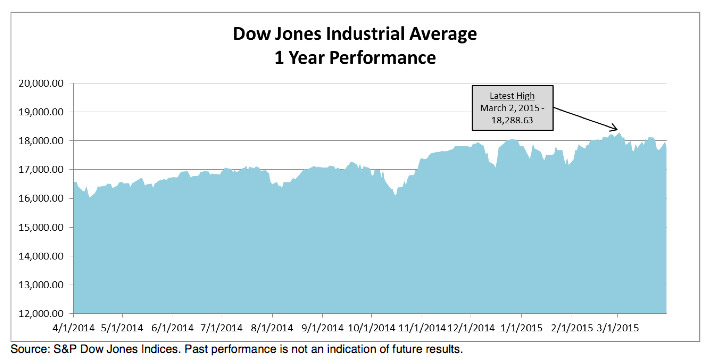
At Quarter End – The Dow Jones Industrial Average ended Q1 2015 at 17,776.12 – down 46.95 points or – 0.26 % from the close of 20 14 . In comparison, the DJIA’s average Q1 return over the prior 30 years is 3.18%.
Leader & Laggard – Boeing Co. (BA) contributed the most to the Average’s advance; American Express (AXP) was the leading detractor.
Industry Performance – Consumer Services was the best performing industry, Financials the worst.
Component Changes – Apple Inc. (AAPL) replaced AT&T Inc. (T) as of the opening on Thursday , March 19 , 2015.
Choppy – Q1 recorded 20 daily moves of greater than 1% (up or down).
Best Day: In Points & Percent – up 323.35 points or 1.84 % on January 8th as the fall in crude oil stabilized and central bankers affirmed a cautious stance regarding rate increases.
Worst Day: In Points – down 332.79 points (or – 1.85 %) on March 10th as concerns about a strong US dollar, tighter banking rules and uncertainty in Europe weighed on equity prices.
In Percent – 1.86% (or – 331.34 points) on January 5th as traders returned to the first full week after the holidays only to see crude oil fall below $50/barrel.


