3 Charts That Show Why Investors Should Stay the Course Throughout Market Turmoil
From: www.morningstar.com
What we’ve learned about sticking out bear markets, avoiding short-term losses, and not trying to time the market.
When investors experience market turmoil like that of the past couple of weeks, it can be hard to keep focused on the long-term potential of investing in stocks, even in spite of evidence that staying the course is in their best interests.
To bring that evidence to life, we’ve compiled three charts that illustrate the historical long-run gains for stocks and the perils of trying to time the market.
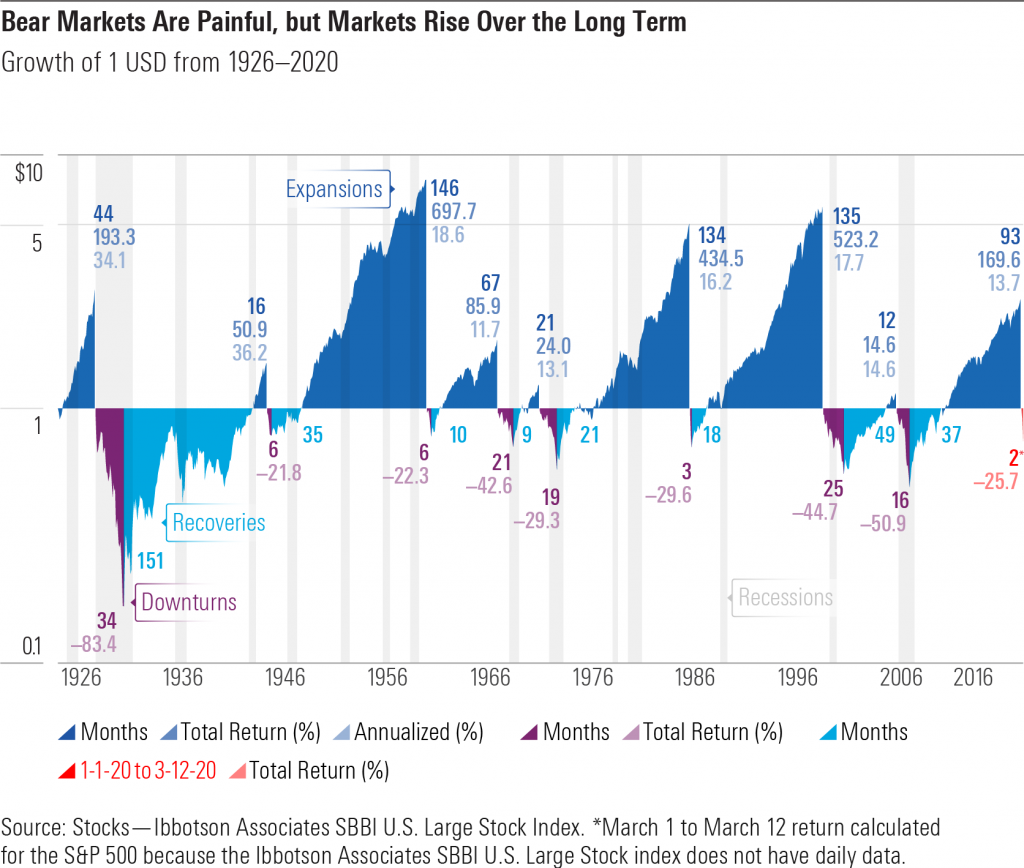
1. Bear Markets Are Painful, but Markets Rise Over the Long Term
Prior to the coronavirus sell-off, there had been eight market downturns since 1926, the most severe being the Great Depression. The chart below, which is based on monthly returns, shows these rises and falls.

More recently, as the chart shows, the “lost decade” of the 2000s included two consecutive downturns with little to no expansion–the dot-com bust of 2000-02 and the Great Recession of 2007-09–that discouraged U.S. investors.
At its lowest point, the market was returning negative 50.9%. But then it began rising again, resulting in a total of 93 months of expansion that lasted through the end of 2018.
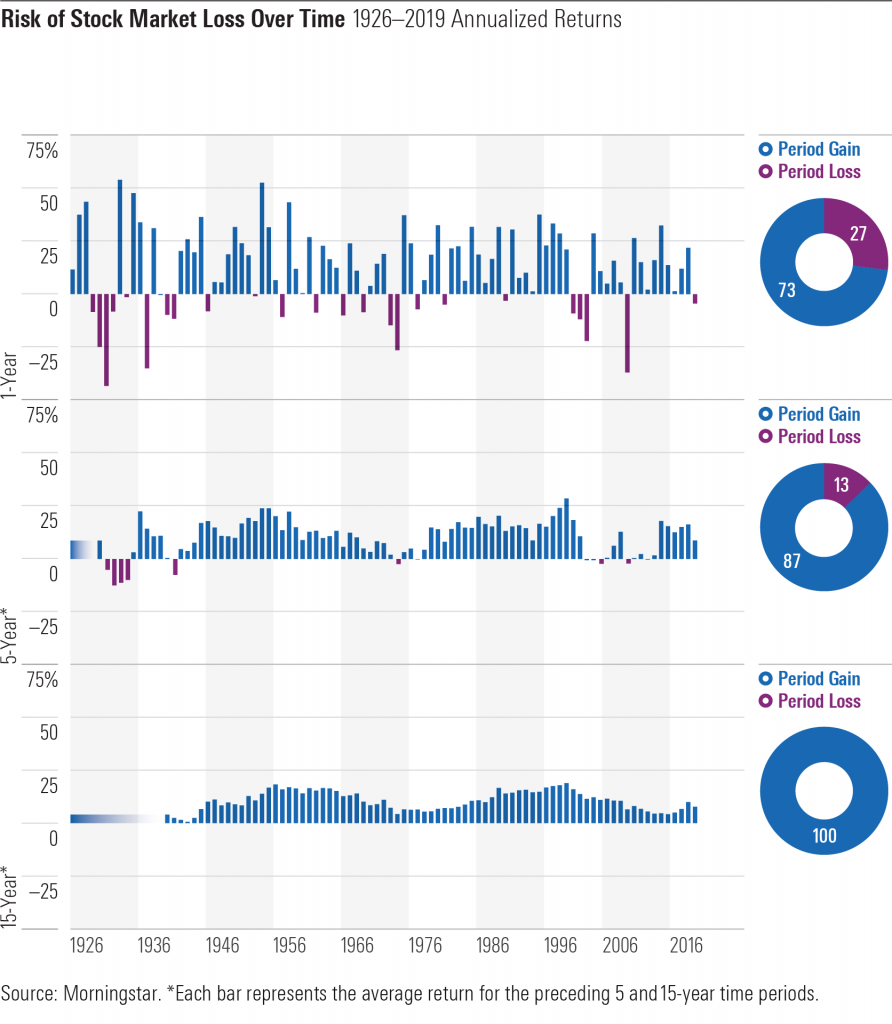
2. Risk of Stock Market Loss Is Lower Over Longer Periods
Although stocks are sometimes considered risky investments, their long-term gains have been demonstrated to offset short-term losses.
The graph below illustrates the realized losses in the stock market for one-, five-, and 15-year periods. It shows:
- Of the 94 one-year periods since 1926, 25 have resulted in a loss.
- Of the 90 overlapping five-year periods since 1926, only 12 have resulted in a loss.
- Of the 80 overlapping 15-year periods since 1926, none have resulted in a loss.

3. The Impact of Ineffective Market-Timing Is Significant
Investors who attempt to time the market run the risk of missing periods of exceptional returns, therefore negatively affecting their investment strategy.
The image below illustrates the risk of attempting to time the stock market by showing the effects of missing the one best month on an annual return.

Missing the single best month during a year drastically reduced returns. During years when returns were already negative, the effect of missing the best month only exaggerated the year’s loss. And in seven of the 49 years shown (1970, 1978, 1984, 1987, 1994, 2011, and 2015), missing the best month would have dragged otherwise positive returns into negative territory.
Although successful market-timing may improve portfolio performance, it is very difficult to time the market consistently. In addition, unsuccessful market-timing can lead to a significant opportunity loss.

