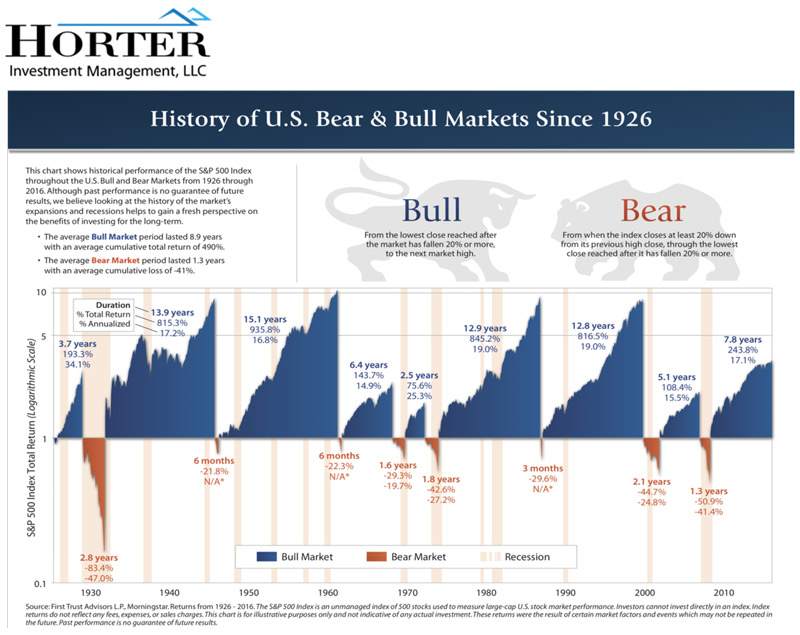
“This chart shows historical performance of the S&P 500 index throughout the U.S. Bull and Bear Markets from 1926 through 2016. Although past performance is no guarantee of future results, we believe looking at the history of the market’s expansions and recessions helps to gain a fresh perspective on the benefits of investing for the long-term.”
To view the PDF:

